Our Work
We are excited to highlight examples of our recent work in standards and web applications. For a more in-depth understanding of our approach to projects, see our Services Page.
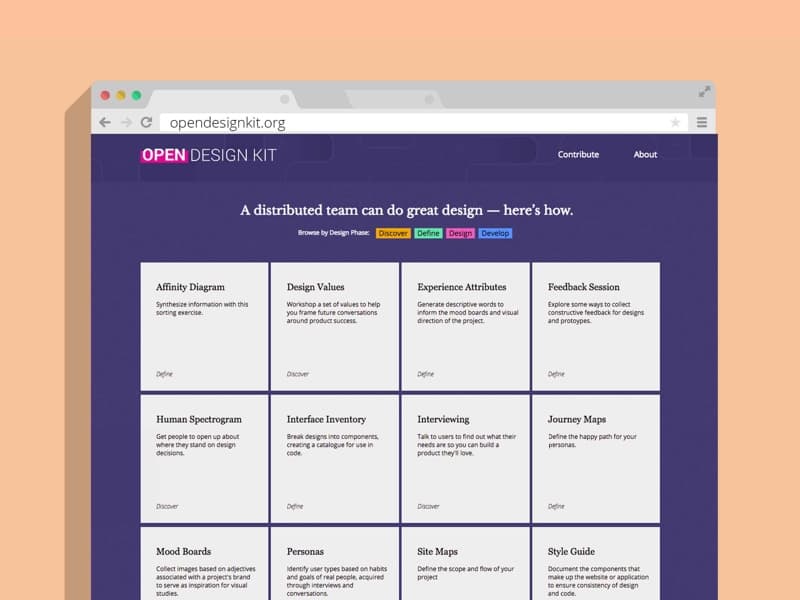
Methods for doing distributed design
Explore how Bocoup is openly compiling a suite of learning materials, methods, and systems to help our staff, clients, colleagues, and community better understand how we design and when to roll up their sleeves and get in on the action.
Learn More about Open Design Kit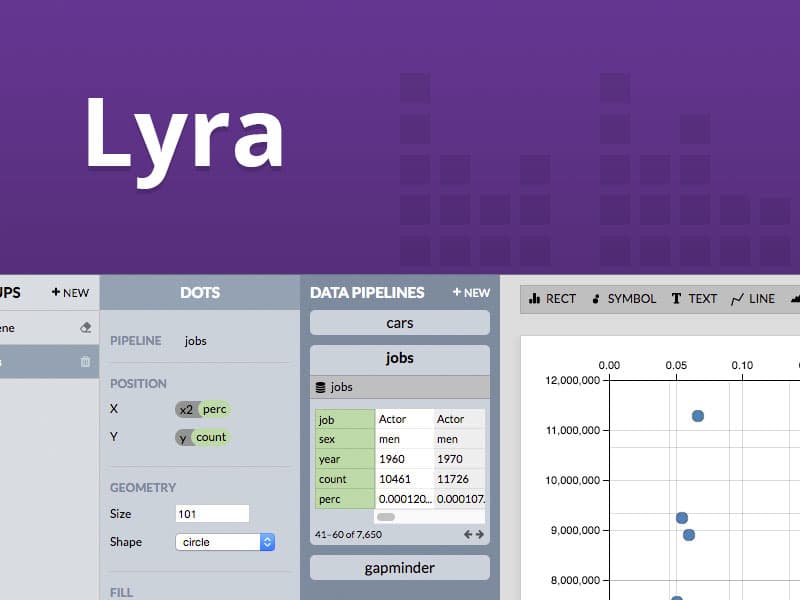
Designing and building a better user experience and technical architecture using React and Redux.
Find out how we worked with the Interactive Data Lab at the University of Washington to design, architect and help build the next version of Lyra, an interactive visualization development tool.
Learn More about Lyra – Visualization Design Environment
Assisting Family Planning Clinic Managers to Track and Drive Service Improvements with a Clinic Efficiency Dashboard
Learn how Bocoup worked with JSI to design and build a WordPress-powered application to empower family planning clinic and service site managers to transform their quality improvement metrics into insights and actionable data.
Learn More about JSI Clinic Efficiency Dashboard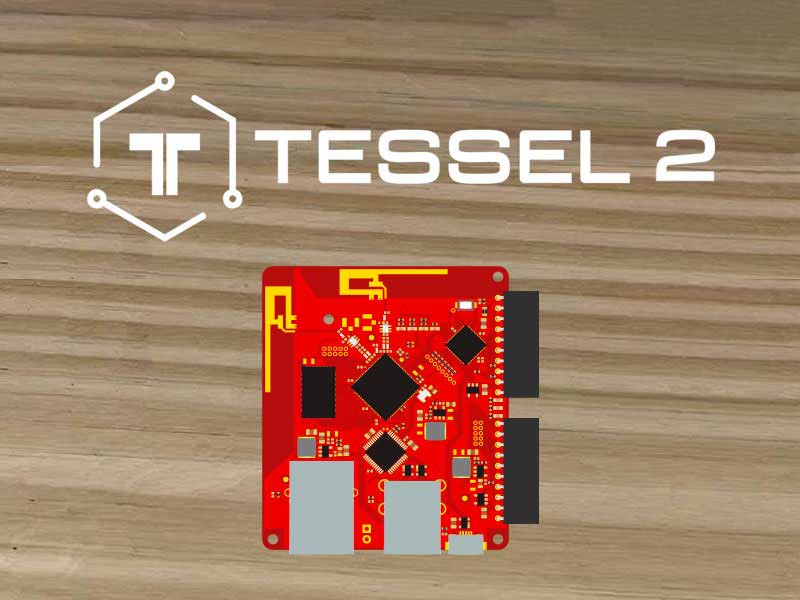
Tessel 2 is an open source micro-controller with first-class support for node.js.
Learn how we are working with the Tessel team to make it simple for students, tinkerers, and companies to create IoT products and robotics projects with JavaScript and Tessel 2, an affordable and powerful microprocessor.
Learn More about Tessel 2
The cobblers have new running shoes.
Learn more about Bocoup.com—a fast, accessible, and easy-to-maintain responsive website Bocoup designed and built for the most exacting client of all: ourselves.
Learn More about Our Website
Making data exploration and visual analysis more accessible with Voyager
Explore how we collaborated with the Interactive Data Lab at the University of Washington to make custom exploration and analysis of data more accessible to a wider audience with Voyager, a visualization browser for open-ended data exploration.
Learn More about Voyager
The challenge of porting flash games to a non flash interface.
Learn how Bocoup helped the Game Show Network grow audience engagement by developing a mobile-first strategy for moving their catalog of Flash-based desktop games to the mobile web.
Learn More about Game Show Network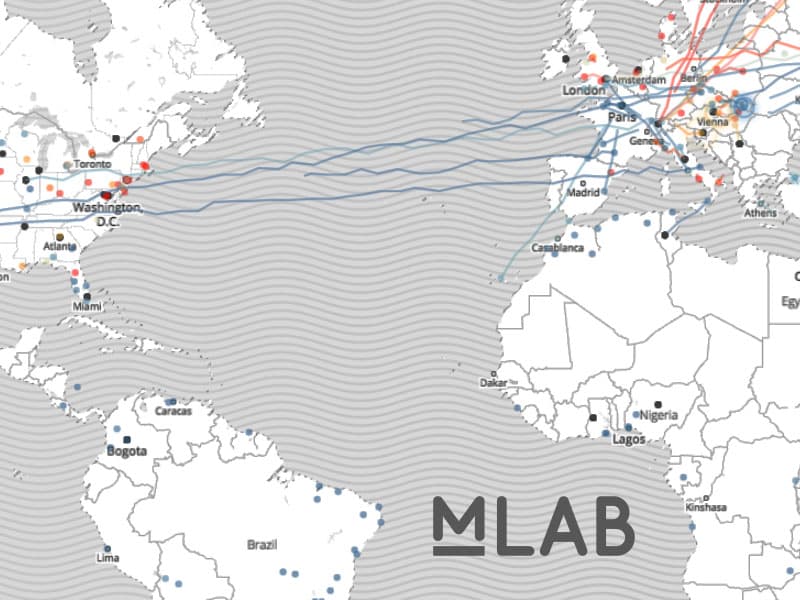
Processing, analyzing and visualizing 800,000,000+ speed tests.
Find out how Bocoup worked with Measurement Lab team to transform hundreds of millions of network diagnostic test results into engaging visualizations and accessible APIs.
Learn More about Measurement Lab
Illuminating Global Drivers of Productivity & Prosperity
Find out how we worked with the World Economic Forum to build interactive and engaging visualizations for the Global Competitiveness Report to illuminate the global drivers of productivity and prosperity.
Learn More about Global Competitiveness ReportOur Clients