Our Work
We are excited to highlight examples of our recent work in standards and web applications. For a more in-depth understanding of our approach to projects, see our Services Page.

Exploring the language used to describe male and female tropes in films
Stereotropes is an interactive visualization experiment exploring a set of tropes authored and tracked by the community on the TV Tropes website. Specifically, this project focuses on gender and the differences between words and associations for male and female tropes. Stereotropes was designed and built by the Bocoup Data Visualization team. We conducted the text analysis, designed the visualizations, interfaces and user experience, and implemented the entire project as a front-end JavaScript application using Backbone and d3.js.
Learn More about Stereotropes
Bringing together Data Visualization Practitioners on the Open Web
Learn how the Bocoup Data Visualization team convenes an annual two-day conference about the practice of Data Visualization on the Open Web.
Learn More about OpenVis Conf
Providing local regions and policy makers with tailored local information to understand and respond to the risks of sea level rise and coastal flooding
Find out how we worked with Climate Central to build a planning tool to provide local sea level rise and flood risk projections, interactive charts and maps, and exposure predictions.
Learn More about Surging Seas Risk Finder
A JavaScript toolkit for performing data analysis and creating visualizations
Discover how we worked with [Santiago Ortiz](http://moebio.com/) and his team to improve and open source the Moebio Framework, a JavaScript toolkit for performing data analysis and creating canvas-based visualizations.
Learn More about Moebio Framework
Promoting best practices and improved organization within open source projects.
Bocoup was actively involved in the development of workflow best practices around the backbone project releasing and popularizing tools like backbone-boilerplate, which lead the conversation about front end web application development at the time. We also started and ran the Backbone conference, and designed the projects logo.
Learn More about Backbone.js
Making Health Data Actionable
Learn more about how the JSI team worked with Bocoup to empower Title X family planning and health centers to manage and drive action with a functional and engaging dashboard for visualizing comparative public health data and progress metrics.
Learn More about Responsive Family Planning Dashboard
Building tangible interactive classroom activities to support economics education
Find out how we worked with the Council for Economic Education to build interactive classroom activities around economic concepts.
Learn More about Council for Economic Education, Learning Activities
Exploring patterns in the NPM software package ecosystem
Learn about our analysis of the NPM package ecosystem and the interactive visualizations we built to explore and demonstrate our findings.
Learn More about NPM By Numbers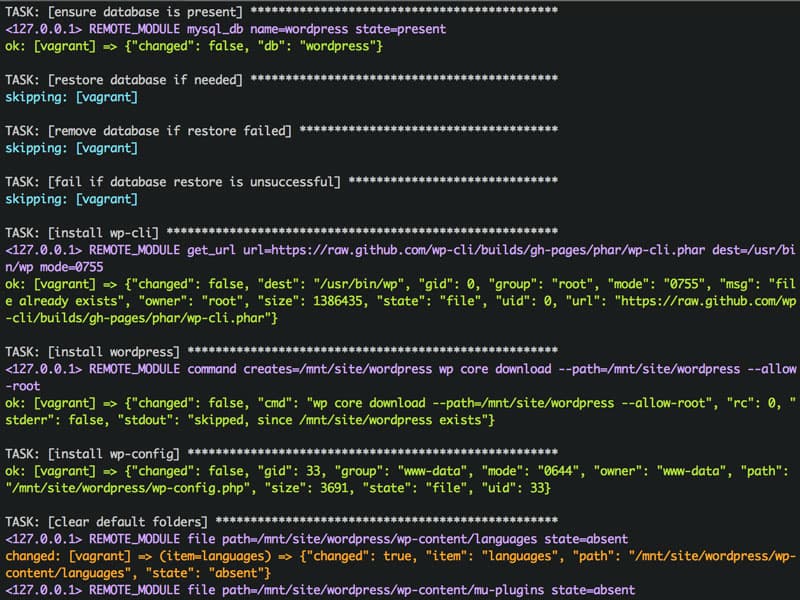
Because Shipping Means Getting It Online
Learn how the Bocoup dev ops team developed a series of Ansible playbooks to help Bocoupers and the broader developer community get their projects onto the web and to their users.
Learn More about Modern Web Deployment WorkflowOur Clients